The following screens demonstrate the exploratory data analysis features of Datapup when using it in Python workspace mode.
NOTE: The following guide uses data from data.gov.au and is licensed under Creative Commons Attribution:
– Airport traffic data https://data.gov.au/dataset/ds-dga-cc5d888f-5850-47f3-815d-08289b22f5a8
– NSW COVID-19 cases by age range https://data.gov.au/dataset/ds-nsw-3dc5dc39-40b4-4ee9-8ec6-2d862a916dcf
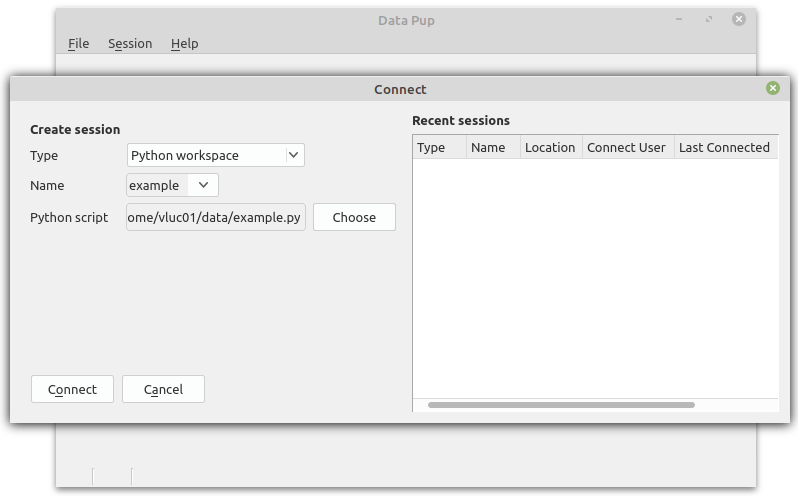
First, create a python workspace, here called “example”. Specify a file where you will put your Python script code.
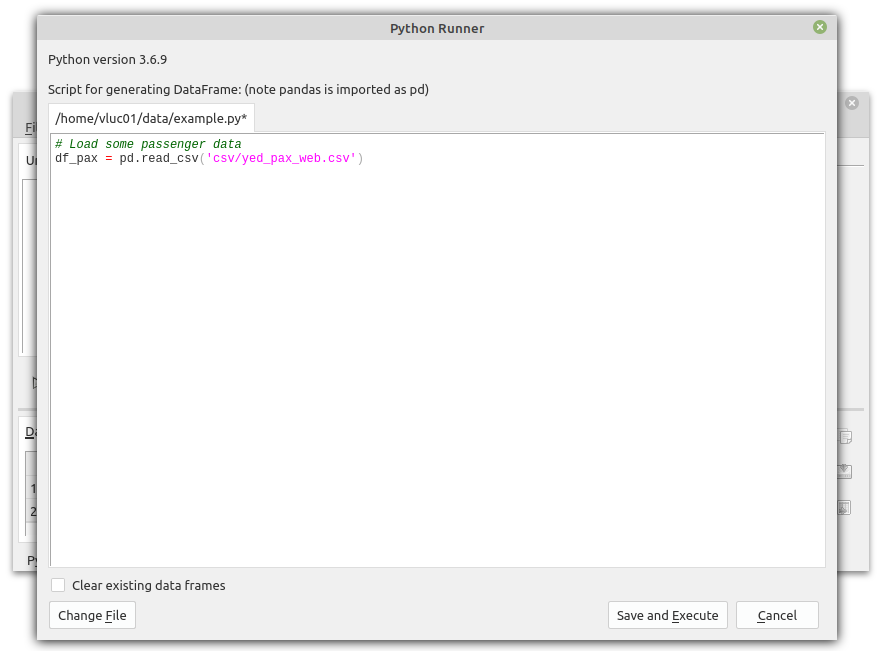
Click on DataFrames > Python Script, or click on the code button shown below to access the Python editor window:

This window allows you to enter Python code that creates Pandas DataFrames. Any variable that is a dataframe will be available for querying. Here I load a csv file into the variable df_pax.
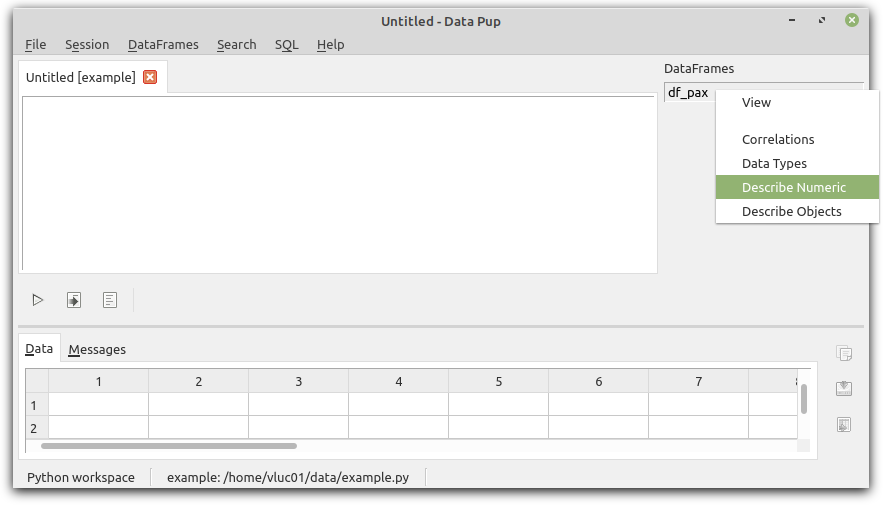
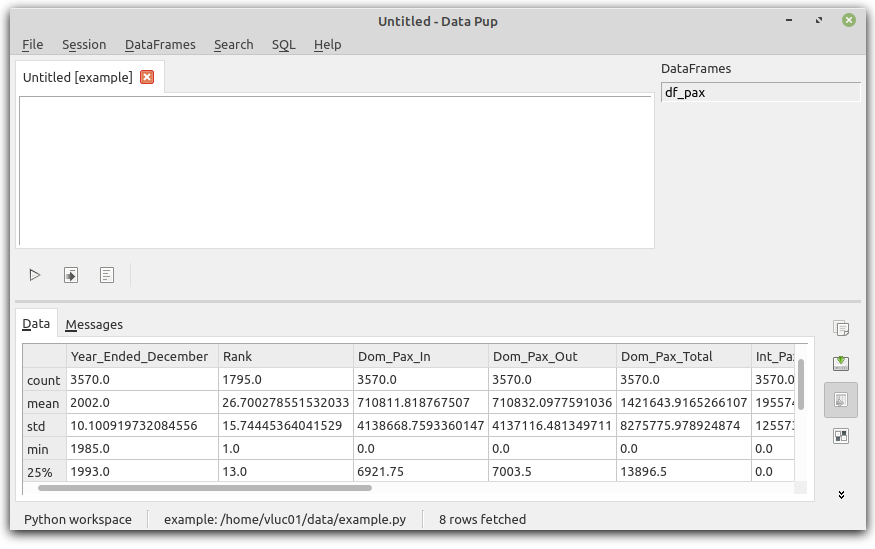
DataFrames appear on the right. Right click on one, and you can do standard EDA operations like correlations, data types and describe from the Python Pandas library.
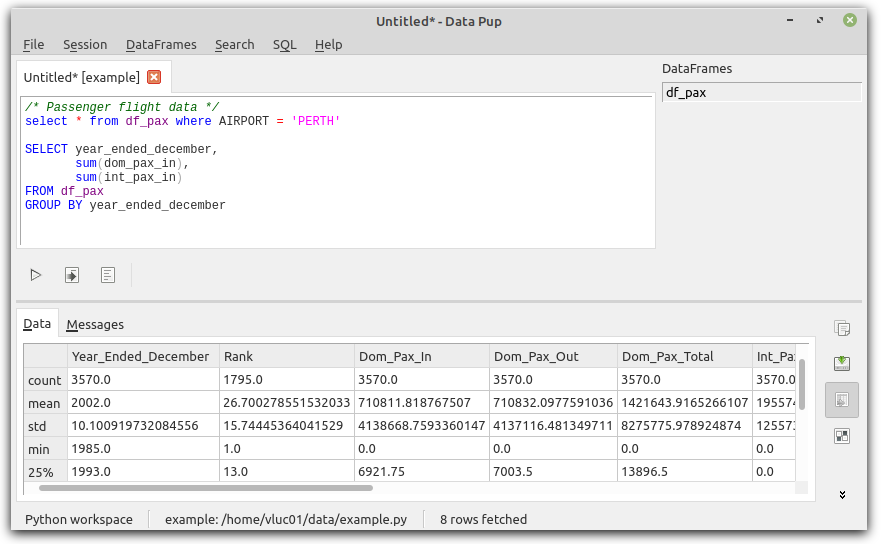
Next, write your SQL directly in the SQL window, and execute using the Run button, or Ctrl-Enter or Shift-F9. (Press Ctrl-H to see all shortcut keys).
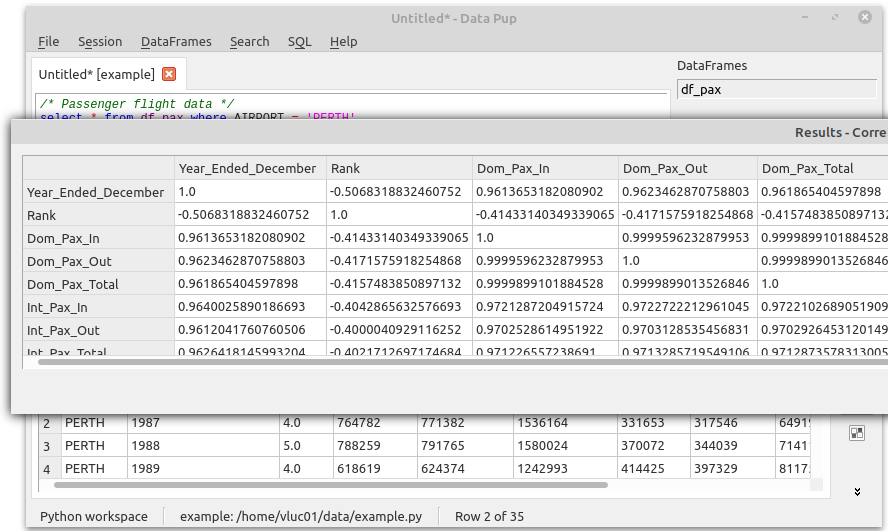
Right click on the results, or use the buttons on the right, to run commands such as correlation and describe on the output table.
Plots and counts
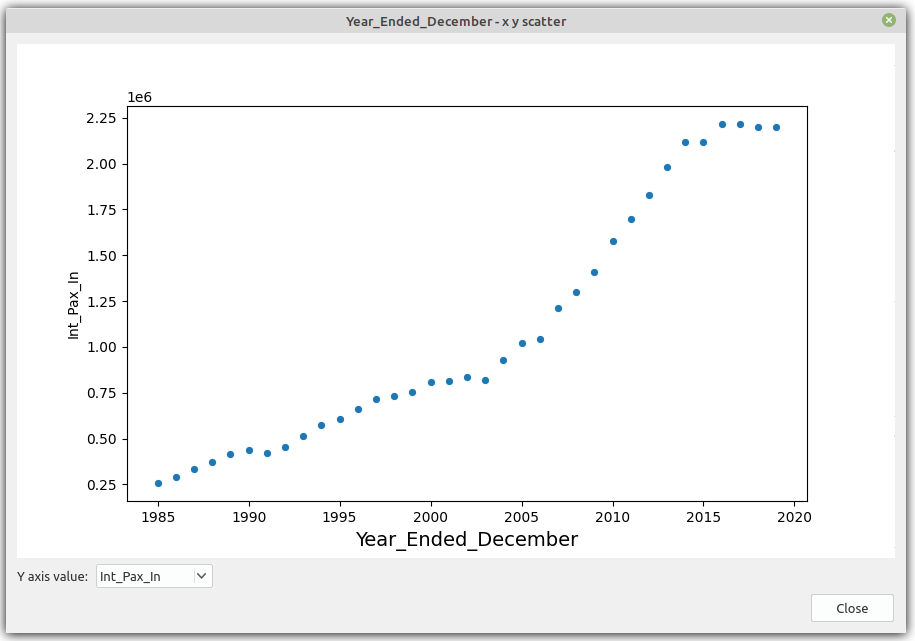
Right click on a column header in the results, to run commands such as box plots and scatter plots.
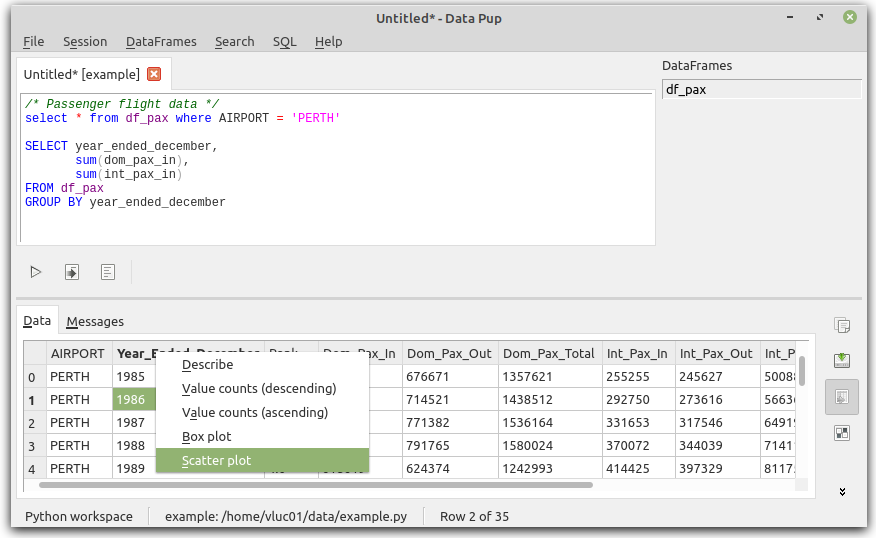
Here I’ve chosen Int_pax_in for the Y axis value.
Importing CSV using the GUI
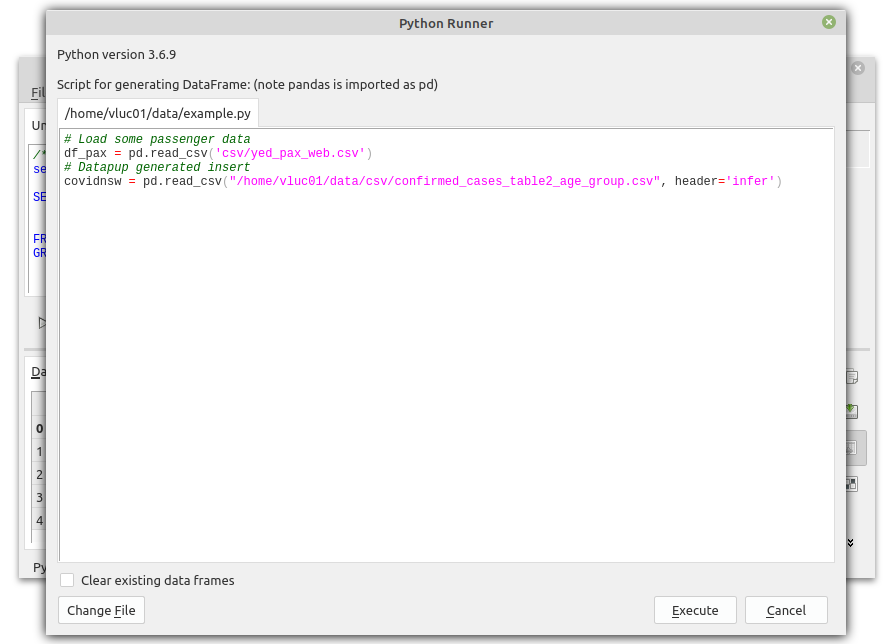
Back to the main window, from the menu DataFrames > Import CSV, you can import CSV files without writing Python. Here I’ve given the DataFrame a name of covidnsw, and accepted defaults.

Data Pup has automatically updated the python script (since I left the update python script option checked)
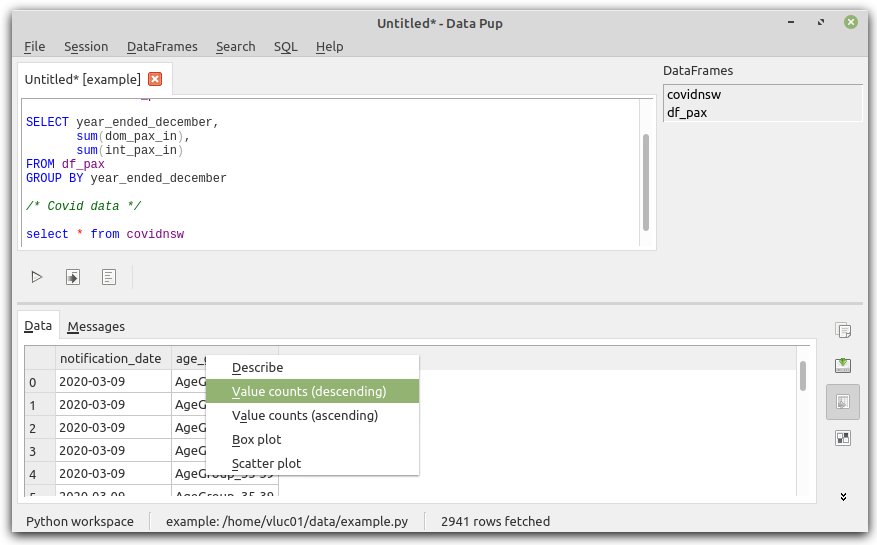
Back in the main window, add some additional SQL to query the new DataFrame covidnsw, and execute it.
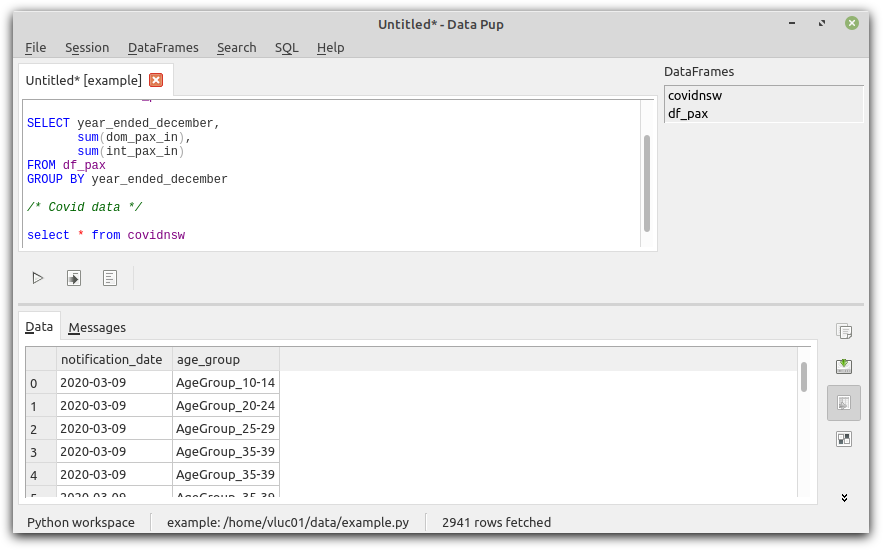
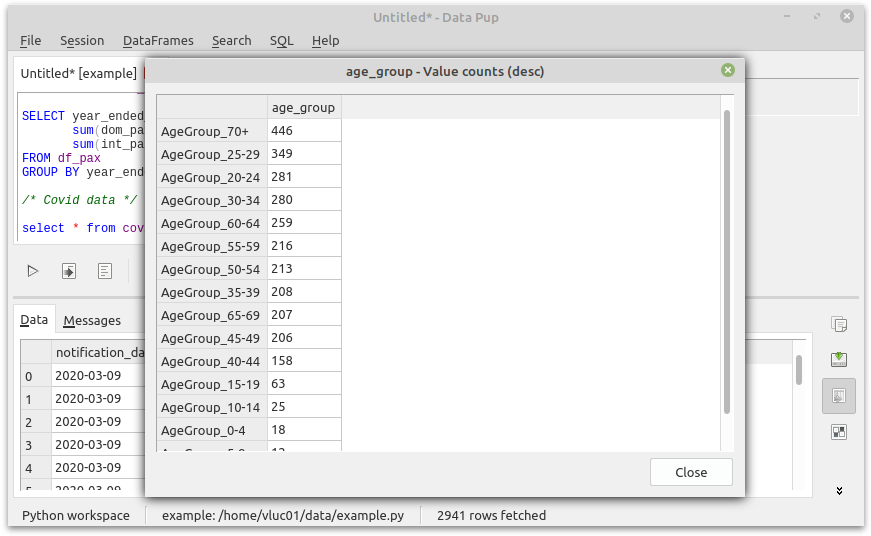
Right click on column age_group and choose value counts.